
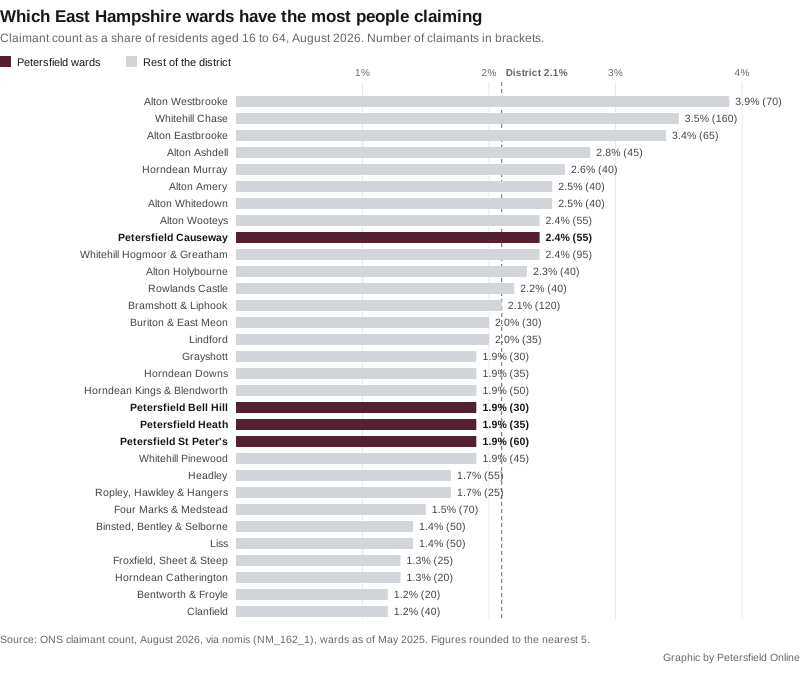
Alton Westbrooke has the district's highest claimant rate at 3.9%, Clanfield and Bentworth the lowest at 1.2%. Petersfield's four wards sit at or below 2.1%.
1,565 people in the East Hampshire district were claiming unemployment-related benefits in August 2026. The figure was published through nomis on 15 September. It is 2.1% of residents aged 16 to 64.
The district total tells you very little about your own street. The same release breaks the count down to all 31 district wards, and the gap across them is more than threefold.
- Alton Westbrooke has the highest rate: 3.9%, or 70 claimants.
- Whitehill Chase has the most people claiming of any ward: 160, a rate of 3.5%.
- Bentworth & Froyle and Clanfield are lowest, both 1.2%.
- Petersfield’s four wards are Causeway 2.4%, and Bell Hill, Heath and St Peter’s all on 1.9%.
Only one Petersfield ward, Causeway, sits above the district average. Together the town’s four wards account for 180 claimants, about one in nine of the district total.
Where the claims cluster
Two parts of the district carry most of the count. Alton’s seven wards hold 355 claimants between them. The three Whitehill and Bordon wards hold 300, and neighbouring Lindford adds another 35.
Six of the ten highest-rate wards are in Alton. The other four are Whitehill Chase, Whitehill Hogmoor & Greatham, Horndean Murray and Petersfield Causeway.
At the other end sit the rural wards and the villages west and south of Petersfield. Froxfield, Sheet & Steep is on 1.3%. Liss and Binsted, Bentley & Selborne are both on 1.4%.
Two cautions on the ward figures. Every number is rounded to the nearest five, so the 31 wards add up to 1,570 against a district total of 1,565. And ward figures for this series only start in 2026, so there is no year-ago ward comparison to make.
The district figure, in context
East Hampshire’s 2.1% is low. The UK rate in August was 3.9% and the South East’s was 3.1%. Of Hampshire’s 13 council areas only Hart (1.8%), Fareham (2.0%) and Test Valley (2.0%) are lower. Winchester matches East Hampshire at 2.1%, and Portsmouth is highest at 4.5%.
The count rose 55 over the year, from 1,510 in August 2025. That is a 3.6% rise, against 2.1% across the UK and 3.7% across the South East. In other words East Hampshire moved almost exactly in line with its region.
Set against the longer run, August 2026 is not a peak. The district’s August figure was 1,660 in 2024 and 1,510 in 2025. It is, though, still well over double the 695 recorded in August 2019, before the pandemic and before Universal Credit had finished rolling out.
The over-50 spike has eased
We reported last month that over-50s were driving the district’s rise, at a rate steeper than any other Hampshire authority. August softens that.
| Age group | Aug 2025 | Aug 2026 | Change |
|---|---|---|---|
| 18 to 24 | 255 | 270 | +15 |
| 25 to 49 | 855 | 860 | +5 |
| 50 and over | 395 | 435 | +40 |
| All ages | 1,510 | 1,565 | +55 |
Over-50s still account for 40 of the 55 extra claimants, and their 10.1% rise is well above the UK’s 3.6%. But the group fell by 25 over the month, from 460 in July, and East Hampshire is now fourth in Hampshire on that measure rather than first. Eastleigh (15.2%) and Hart (14.0%) are both steeper.
The local pattern still runs against the national one. Across the UK the fastest growing group is the under-25s, up 10.0% over the year. In East Hampshire that group rose 5.9%, roughly half the national pace.
One correction is worth making plainly. Last month’s July total of 1,580 has since been revised down to 1,555 in the ONS series, with the 18 to 24 and 25 to 49 bands both reduced. Revisions of that size are routine in this data.
What it means for you
- This is not the unemployment rate. The claimant count measures people claiming Jobseeker’s Allowance, or claiming Universal Credit and required to look for work. People who are unemployed but not claiming, and people claiming while in low-paid work, are counted differently.
- Ward figures are rounded to the nearest five. Treat a ward on 20 as a small number rather than an exact one.
- If you are claiming, the conditions attached to a Universal Credit claim are set out on gov.uk. Help with a claim, including a dedicated phone line, is available through Citizens Advice Help to Claim.
- If you are hiring, the ward table shows where in the district the available labour actually is, and it is not evenly spread.
Sources
- ONS claimant count by sex and age (NM_162_1), via nomis, released 15 September 2026, for every district, ward, age and benchmark figure in this article. Ward figures use the “Wards as of May 2025” geography.
- ONS, Claimant count methodology for what the measure does and does not include.
Related
- Petersfield house prices, what homes here actually sell for.
- Petersfield council tax bands, and why a GU32 address is not always the Petersfield charge.
- Petersfield planning news, the housing coming to the town.
Have your say