
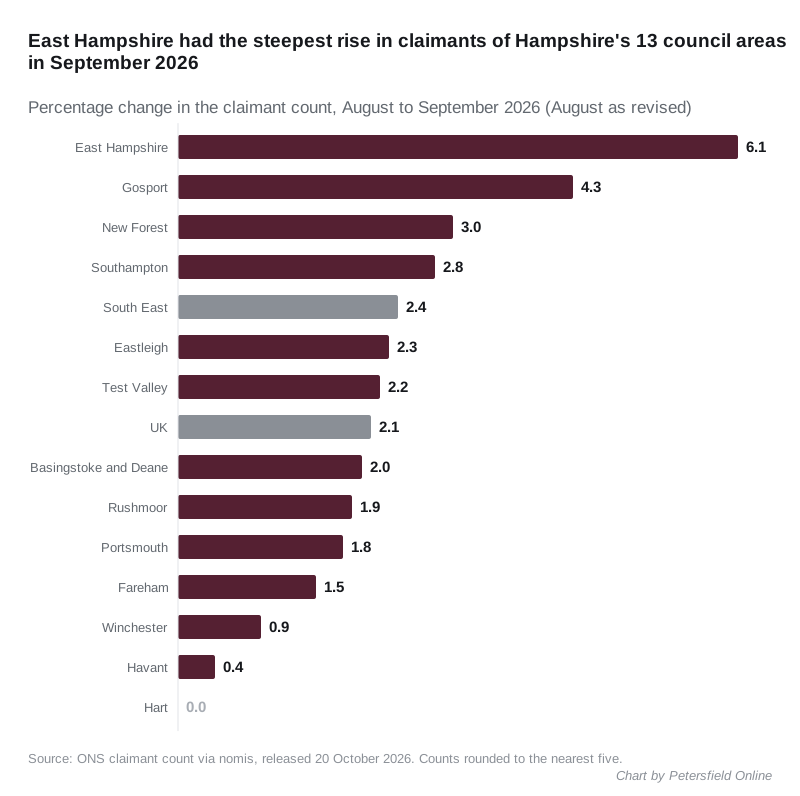
East Hampshire's claimant count rose 6.1% in September, the steepest rise of Hampshire's 13 council areas. Petersfield's four wards went from 180 to 200.
1,640 people in the East Hampshire district were claiming unemployment-related benefits in September 2026, up 95 in a month. That is a rise of 6.1%, the steepest of Hampshire’s 13 council areas and nearly three times the UK rate.
The figures were published by the Office for National Statistics through nomis on 20 October. The count is now 2.2% of residents aged 16 to 64, up from 2.0%.
How the district compares
East Hampshire still has one of the lower claimant rates in the county. The change is what stands out. Over the same month the count rose 2.1% across the UK and 2.4% across the South East, and Hart’s did not move at all.
| Area | August 2026 | September 2026 | Change in a month | Change in a year | Rate, 16 to 64 |
|---|---|---|---|---|---|
| East Hampshire | 1,545 | 1,640 | +6.1% | +8.6% | 2.2% |
| Gosport | 1,750 | 1,825 | +4.3% | +8.0% | 3.7% |
| New Forest | 2,185 | 2,250 | +3.0% | +1.1% | 2.3% |
| Southampton | 7,285 | 7,490 | +2.8% | +5.0% | 4.2% |
| Eastleigh | 1,965 | 2,010 | +2.3% | +4.7% | 2.3% |
| Test Valley | 1,575 | 1,610 | +2.2% | +4.9% | 2.0% |
| Basingstoke and Deane | 3,270 | 3,335 | +2.0% | +6.2% | 2.7% |
| Rushmoor | 2,055 | 2,095 | +1.9% | +4.5% | 3.0% |
| Portsmouth | 6,345 | 6,460 | +1.8% | +0.2% | 4.5% |
| Fareham | 1,315 | 1,335 | +1.5% | +1.5% | 2.0% |
| Winchester | 1,655 | 1,670 | +0.9% | 0.0% | 2.0% |
| Havant | 2,405 | 2,415 | +0.4% | -4.9% | 3.3% |
| Hart | 1,090 | 1,090 | 0.0% | +8.5% | 1.7% |
| South East | 182,020 | 186,430 | +2.4% | +4.0% | 3.1% |
| United Kingdom | 1,667,095 | 1,702,905 | +2.1% | +2.8% | 3.9% |
Over the year the picture is the same. East Hampshire’s count is up 130 on September 2025, when it was 1,510. That 8.6% rise is also the largest in the county, just ahead of Hart at 8.5% and Gosport at 8.0%.
The district was last at 1,640 in January 2025. Four of the 13 still have a lower rate than East Hampshire’s 2.2%: Hart at 1.7%, and Fareham, Test Valley and Winchester at 2.0%.
Who the rise was among
Most of the month’s increase was among people aged 25 to 49, and more of it was among women than men.
- Aged 25 to 49: 845 to 905, up 60.
- Aged 16 to 24: 265 to 290, up 25.
- Aged 50 and over: 435 to 440, up 5.
- Women: 710 to 770, up 60.
- Men: 835 to 870, up 35.
That is a change from the summer. In July the rise was almost all among the over-50s, and that group has barely moved since.
Petersfield’s wards
The same release breaks the count down by ward. Petersfield’s four wards had 200 claimants in September, up from 180 in August.
- Petersfield St Peter’s: 70, up 10, a rate of 2.2%.
- Petersfield Causeway: 55, up 5, 2.6%.
- Petersfield Heath: 40, up 5, 2.2%.
- Petersfield Bell Hill: 35, no change, 2.1%.
Nearby, Liss went from 50 to 65 and Bramshott & Liphook from 115 to 125. Froxfield, Sheet & Steep stayed at 25, a rate of 1.3%.
Across the district, Whitehill Hogmoor & Greatham rose by 15 to 110. Whitehill Chase still has the most claimants of any ward, 160, and Alton Westbrooke the highest rate, 3.7%. Horndean Catherington has the lowest, at 1.1%. Five wards fell, the largest drop being Alton Holybourne, from 40 to 30.
Read these numbers with care
- Every figure is rounded to the nearest five. A ward moving by five may not have changed at all. The 31 wards add up to 1,635, against 1,640 for the district.
- Last month’s figure has been revised. We reported 1,565 for August; the ONS now puts it at 1,545. The comparisons here use the revised number. Against the figure first published, September’s rise would be 75.
- One month is not a trend. The district count has moved between 1,490 and 1,640 for the past two years.
- It is not the same as unemployment. The claimant count covers people on Jobseeker’s Allowance, and those on Universal Credit who are required to look for work. That includes some people in low-paid jobs who are expected to find more hours.
What it means for you
If you have lost work or had your hours cut, you can check what you are entitled to and apply for Universal Credit on GOV.UK.
For anyone looking at the local jobs market, the rise is spread thinly across the district rather than concentrated in one town. Petersfield, Liss, Liphook and Whitehill all added claimants, while parts of Alton, Headley and Grayshott fell.
The October figures are due from the ONS in November. We will report them here.
Sources
- ONS claimant count, nomis dataset UCJSA (NM_162_1), updated 20 October 2026: district figures for East Hampshire, the other 12 Hampshire council areas, the South East and the UK; the monthly series from September 2024; age and sex breakdowns; and the ward figures for all 31 East Hampshire wards. All read on 21 October 2026.
Have your say