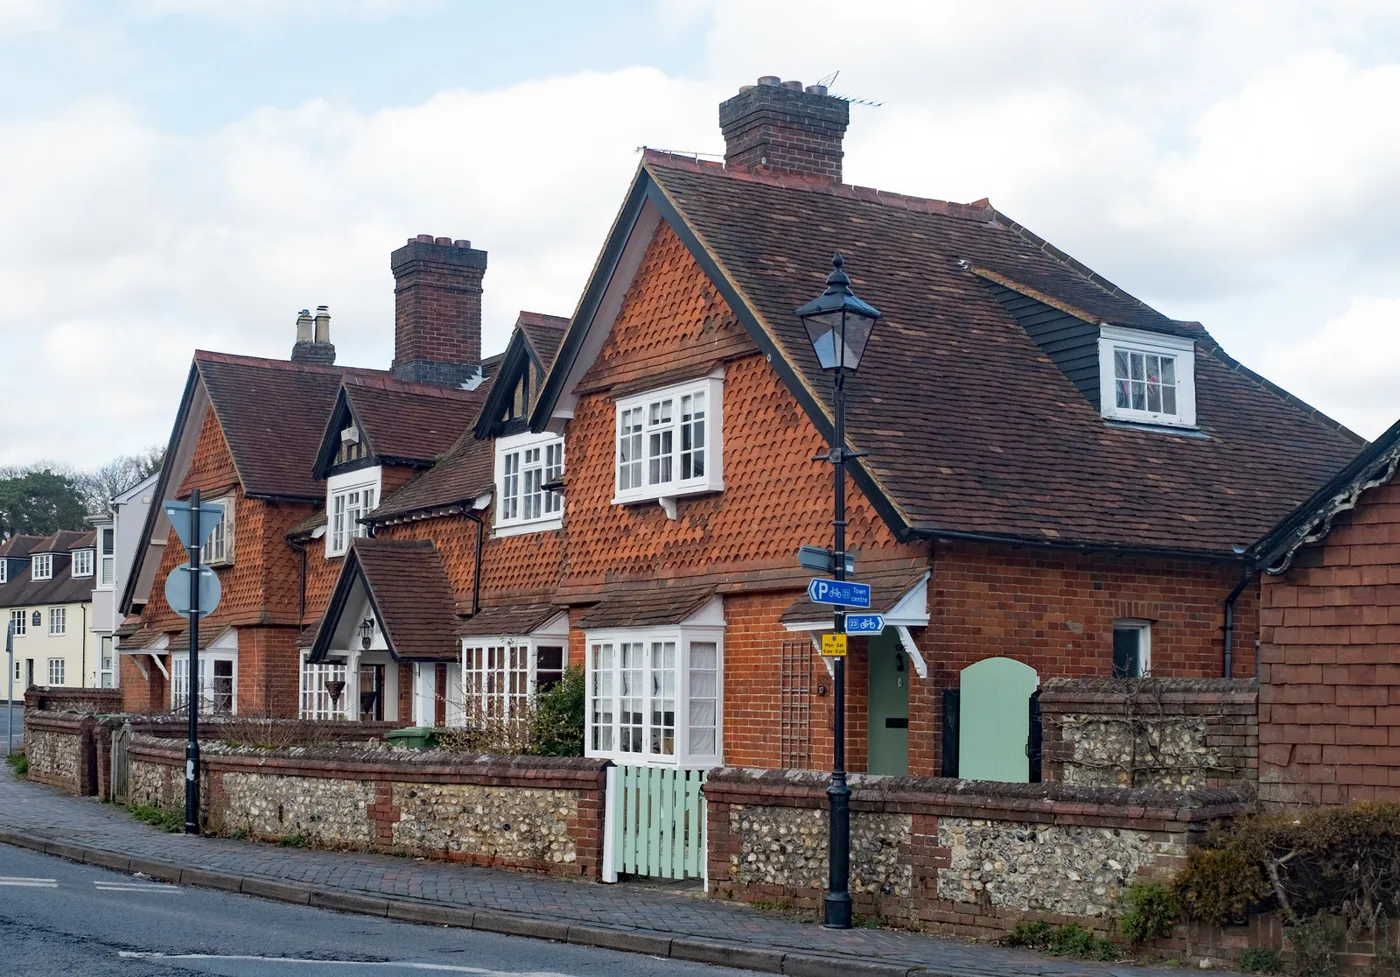

The average East Hampshire home is £440,599, down £7,402 in a year. That 1.7% fall is the steepest of Hampshire's 11 districts. Flats fell 4.2%.
House prices in East Hampshire are falling faster than anywhere else in the county. The average home in the district was worth £440,599 in August 2026. That is £7,402, or 1.7%, less than a year earlier.
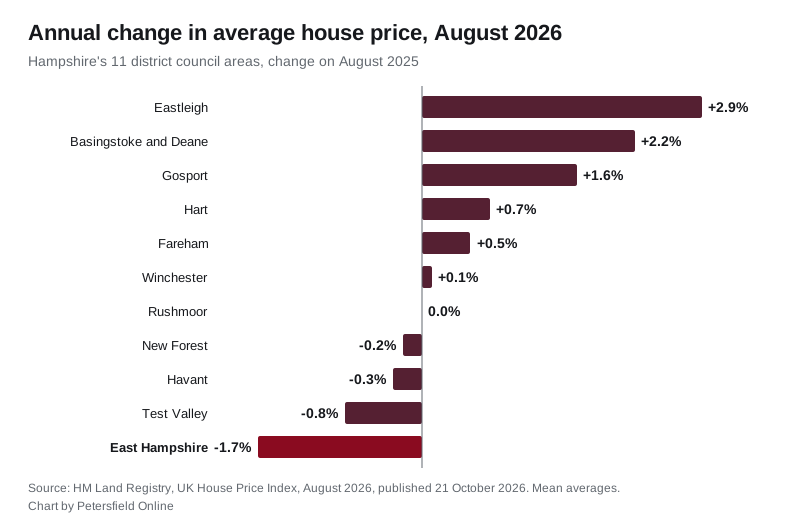
No other district in Hampshire fell as far. Across the Hampshire County Council area as a whole, prices rose 0.5%.
The figures are from HM Land Registry’s UK House Price Index for August, published on 21 October. It is the latest month available.
Where East Hampshire sits in the county
Hampshire has 11 district councils. Six of them saw prices rise over the year, one stood still and four fell. East Hampshire fell the most.
The pattern is not just a Hampshire one. Our two neighbours over the county border to the east fell further still:
| Area | August 2026 average | Annual change |
|---|---|---|
| Waverley (Surrey) | £559,306 | -2.0% |
| Winchester | £453,188 | +0.1% |
| East Hampshire | £440,599 | -1.7% |
| Chichester (West Sussex) | £428,364 | -2.7% |
| South East | £379,953 | -0.8% |
| Hampshire | £364,628 | +0.5% |
| Havant | £319,869 | -0.3% |
| England | £293,525 | +0.4% |
Winchester, next door to the west, showed a 2.1% annual rise in the July figures published in September. In August it is up just 0.1%.
Every type of home is down
All four property types lost value in East Hampshire over the year:
- Detached: down £13,207 to £705,338
- Semi-detached: down £3,002 to £430,757
- Terraced: down £2,532 to £333,662
- Flat or maisonette: down £8,710 to £198,888
Flats fell hardest in percentage terms, by 4.2%. In September we reported that the average East Hampshire flat was worth less than in 2021. It still is: the August average is £3,261 below the August 2021 figure of £202,149.
First-time buyers face an average of £309,704, down £4,674, or 1.5%, on a year ago.
Two cautions on these numbers
This is a mean, not a median. The index averages every sale in the district, so a few large sales in a month pull the figure up. One number covers Bordon, Alton, Petersfield and the villages of the South Downs.
Recent months get revised. Last month we reported the July average as £440,541. The Land Registry has since revised it up to £441,112. So August’s figure is down £513 on the month, not up. Sales volumes lag further still: the latest complete month is June, with 103 sales recorded in the district.
The average is still £18,944 below the district’s October 2022 high of £459,543.
What it means for you
- Selling: buyers in East Hampshire have more room to negotiate than they had a year ago, and more than buyers in most of Hampshire. A detached house is down more than £13,000 on average.
- Buying: prices are softening, but the district is still expensive. The average home here costs £75,971 more than the Hampshire average and £147,074 more than England’s.
- Buying a first flat: at £198,888 the district’s flat average is below Winchester (£226,292) and Chichester (£216,221), though well above Havant (£164,631).
- Checking your own street: a district average is not a street price. Our Petersfield house prices page carries local detail, and the Land Registry’s UKHPI browser lets you pull any month for any district.
Sources
- HM Land Registry, UK House Price Index, East Hampshire, August 2026 release, published 21 October 2026
- HM Land Registry, East Hampshire data for August 2026, July 2026, June 2026 and August 2025
- District, county, regional and national comparisons drawn from the same index for August 2026. Contains HM Land Registry data (c) Crown copyright and database right 2026, licensed under the Open Government Licence v3.0.
Have your say